Analytics
Customize the way you control and analyze all your marketing activities.
Monitor everything from one place
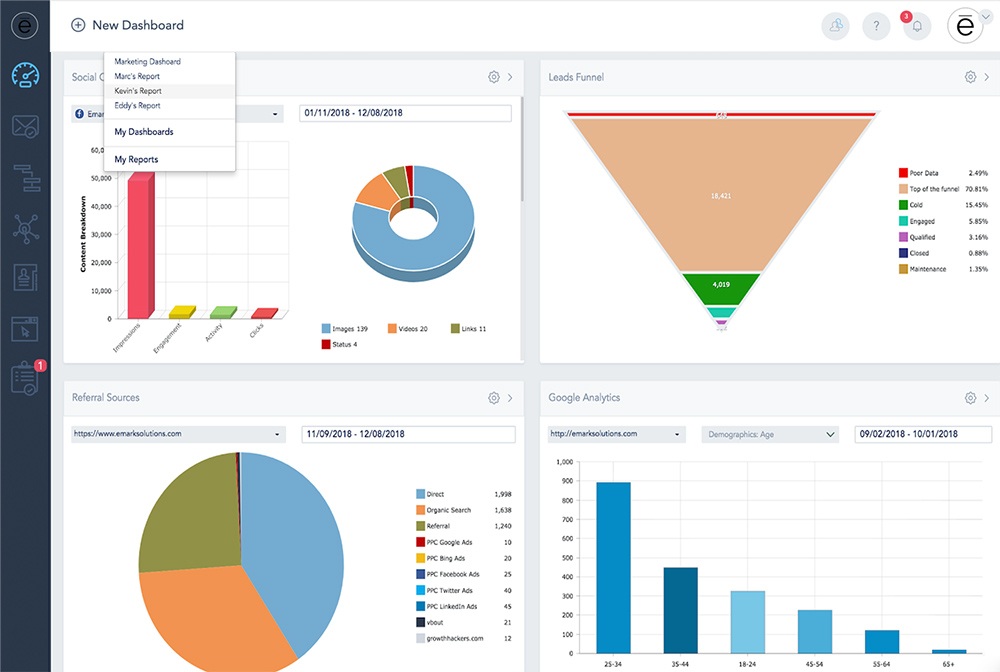
Track your activities across different tools and channels. Check the performance of your website, social media profiles, email marketing campaigns, automations, landing pages and leads. You can also connect all your Google Analytics accounts to have a complete rundown of your KPIs and results.


Customize your dashboard
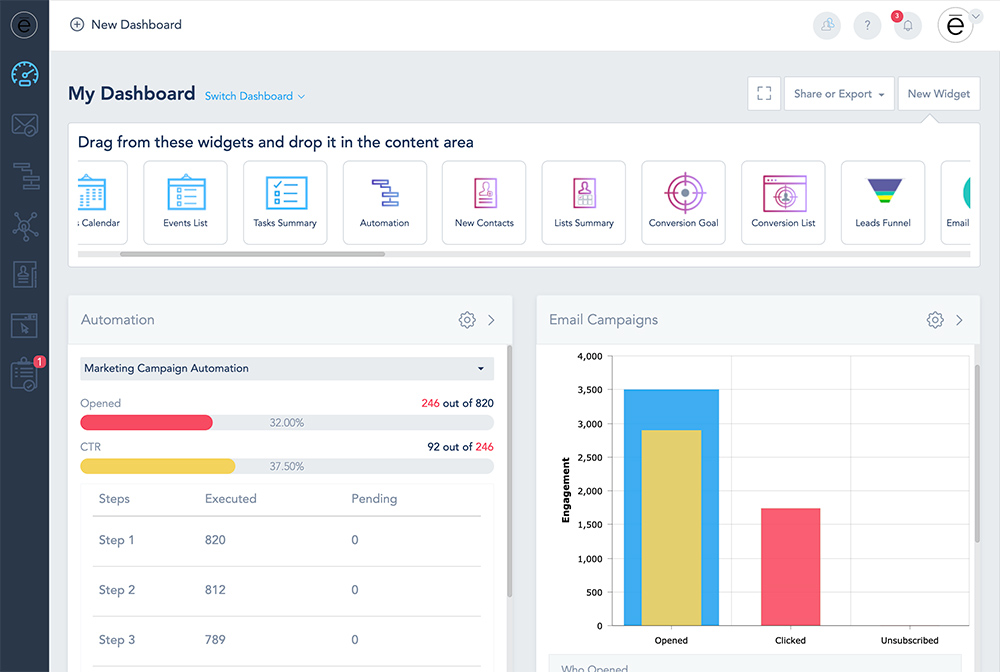
Focus on what matters the most to you. Display your favorite metrics and build your own dashboard using over 30 drag & drop reporting widgets. Visualise your important KPIs, calendars, lists, feeds, tasks, funnels and much more. You can also create multiple dashboards for you and other members of your team or clients.
Set your own success rules
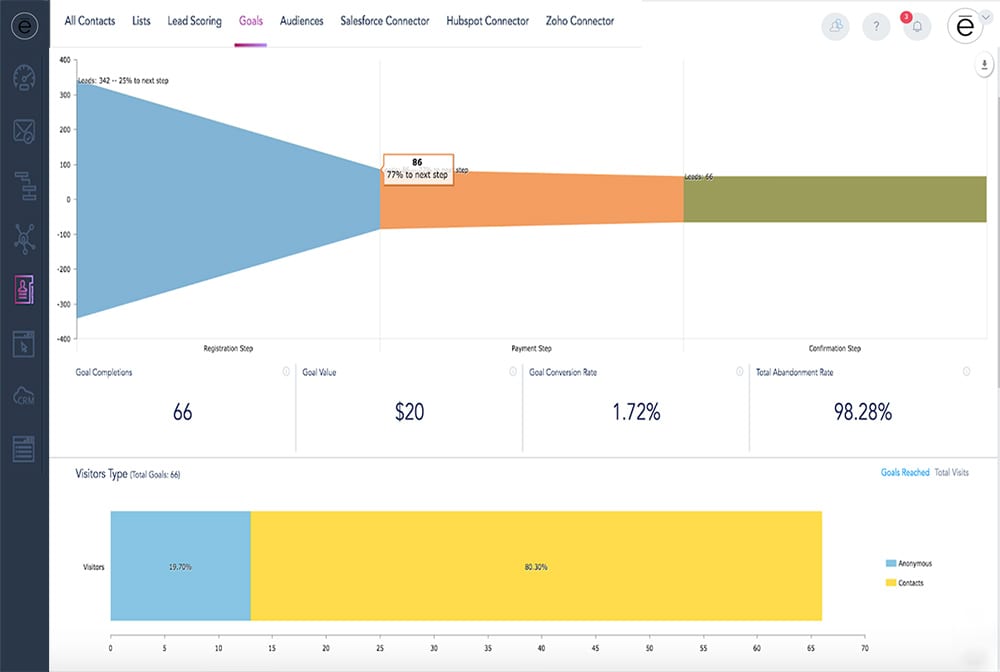
Create your own parameters to track your results in a way that meets your business dynamics and objectives. Create conversion goals and funnels and assign various scores and labels to your leads to track the progress of your marketing activities throughout their stages.


Automate and share your reports
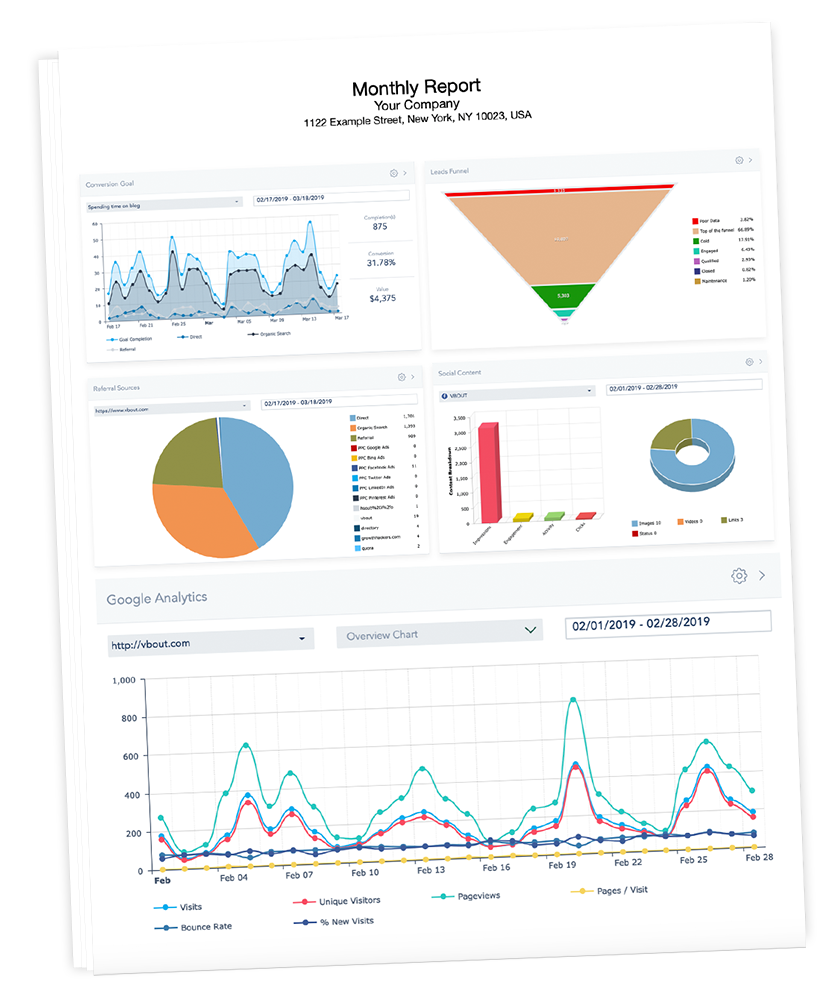
Create custom branded reports and schedule them to be automatically sent to you or to other people on a recurring basis. You can also share them with a publicly accessed URL or export them as a PDF or image report.
Analytics features
- Multiple dashboards⊕
- Customizable dashboard⊕
- 28+ reporting widgets⊕
- Landing pages analytics⊕
- Landing page heatmap⊕
- Email marketing analytics⊕
- Automation analytics⊕
- Lists analytics⊕
- Leads analytics⊕
- Social media analytics⊕
- Twitter search⊕
- Instagram search⊕
- URL click counter⊕
- Conversion tracking⊕
- Popups analytics⊕
- Export reports⊕
- Schedule reports⊕
- Report link⊕
Reporting widgets
Drag & drop and customizable widgets to put on your dashboard, designed to provide you with specific reports and metrics you need to check regularly.
- Getting started⊕
- Website visitors⊕
- Top visited pages⊕
- Top devices⊕
- Top referring countries⊕
- Referral sources⊕
- Paid referral⊕
- Google Analytics⊕
- Site popup⊕
- Landing page⊕
- Leads funnel⊕
- List summary⊕
- Conversion goal⊕
- Conversion list⊕
- New contacts⊕
- Email campaigns⊕
- Automation⊕
- Events calendar⊕
- Events list⊕
- Browser push⊕
- BP templates⊕
- Social insights⊕
- Social feeds⊕
- Social content⊕
- Social followers⊕
- Social sources⊕
- Hashtag stream⊕
- Tasks Summary⊕
Frequently asked questions
How many reports can I generate per month?
You can generate and share as many reports per month as you need. With VBOUT, reporting is UNLIMITED.
Can I have multiple dashboards for different users?
Yes, you can create a different dashboard with a different set of widgets for each user.
Can I schedule reports?
Yes. You can create customized reports and have them sent on a recurrent basis to recipients of your choice.
Can I share my reports with others?
Yes. You can share reports with clients or other team members via a public URL link.
Can I measure social media referrals?
Yes absolutely. Based on the URL click counter, you’ll be able to track the number of clicks for each of your social media posts.
Ready to get started?
Start your free 14-day trial now!
No contract. No Credit Card Required.
COMPANY

SOLUTIONS

BY INDUSTRY

COMPARE

RESOURCES

SUBSCRIBE TO OUR BLOG
Your email will be used to send you relevant marketing content and blog updates. You can unsubscribe at any time using the link in our emails.

Copyright © 2024 Rebellioneer CRM. All rights reserved.


